


This is a set of free visualization platforms hosted by the KnightLab at Northwestern University. These are powerful tools with a low learning curve, providing various types of interactive visualizations for different data types and presentation needs.
Timeline JS – showing a flow of events over time

The Timeline tool takes data with temporal reference points and creates a visually interesting dynamic timeline display. Users enter data, text, and other media into a Google Sheet and the application builds the presentation automatically.
Ideally, a timeline should consist of roughly twenty entries. The sample linked above contains quite a few more, making it a bit difficult to navigate due to the density of markers, but it demonstrates the capability of the tool.
StoryMap JS – telling a story with temporal and geographic dimension

The StoryMap tool creates a dynamic historical map using location data. Its easy-to-use interface allows users to enter text and images to represent events in their geographic locations, and create a moving timeline that follows a map across locations of events.
StoryMap does not require GIS data. An embedded Google Maps search enables placement of content into place and context. As it allows only one entry at a time, it is recommended for smaller narratives with fewer entries.
JuxtaposeJS – a narrative told in two snapshots

Sample photo: Fork Church of the Ascension (Davie County, NC): 1910 & 2009
JuxtaposeJS allows users to create an interactive before-and-after display of an object or place to visually represent them in historic context. The tool overlays two images and allows investigation of changes over time.
Soundcite – stories come to life with embedded audio
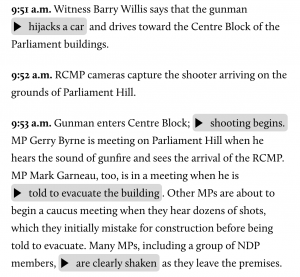
Soundcite uses Soundcloud or other sources of web-hosted audio to stitch streaming audio excerpts into written text.