

Since 2016, the DIL has been collecting tweets using #silentsam. Beginning in January of this year, a team of graduate and undergraduate students have started the process of cleaning and visualizing this data, with the hope of exploring a set of research questions specific to the controversy surrounding the confederate monument in addition to establishing best practices for dealing with social media data in digital humanities projects. With over 60,000 tweets plus metadata, there are a lot of potential avenues for exploration. One early question the team pursued was whether the #silentsam issue extended outside the region into national or international consciousness, both by evaluating to what extent the hashtag attracted bots and by mapping the tweet data. Early examination of the data using popular machine learning algorithms conducted by grad student Yukun Yang with support from Henry McKeand suggests that bot presence for #silentsam is negligible. This discovery led the team to wonder about other campus controversies: a future project may involve scraping or rehydrating tweets surrounding those issues to see if they display a similar local/national/international pattern. For now, the team if focusing on representing this static corpus of tweets (through February 28, 2019) in network visualizations–highlighting hashtag co-occurrence for example — and comparative graphs.
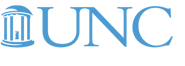
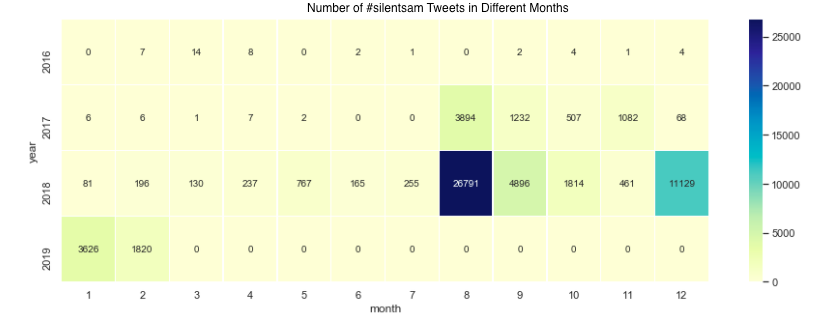
In the exploratory data analysis, the team visualized the #silentsam tweets over time and then the number of unique users contributing to the corpus month-by month.
This map shows the distribution of tweets across the United States (as of February 28, 2019). Note the concentration of tweets in North Carolina, with pockets of interest across the country. 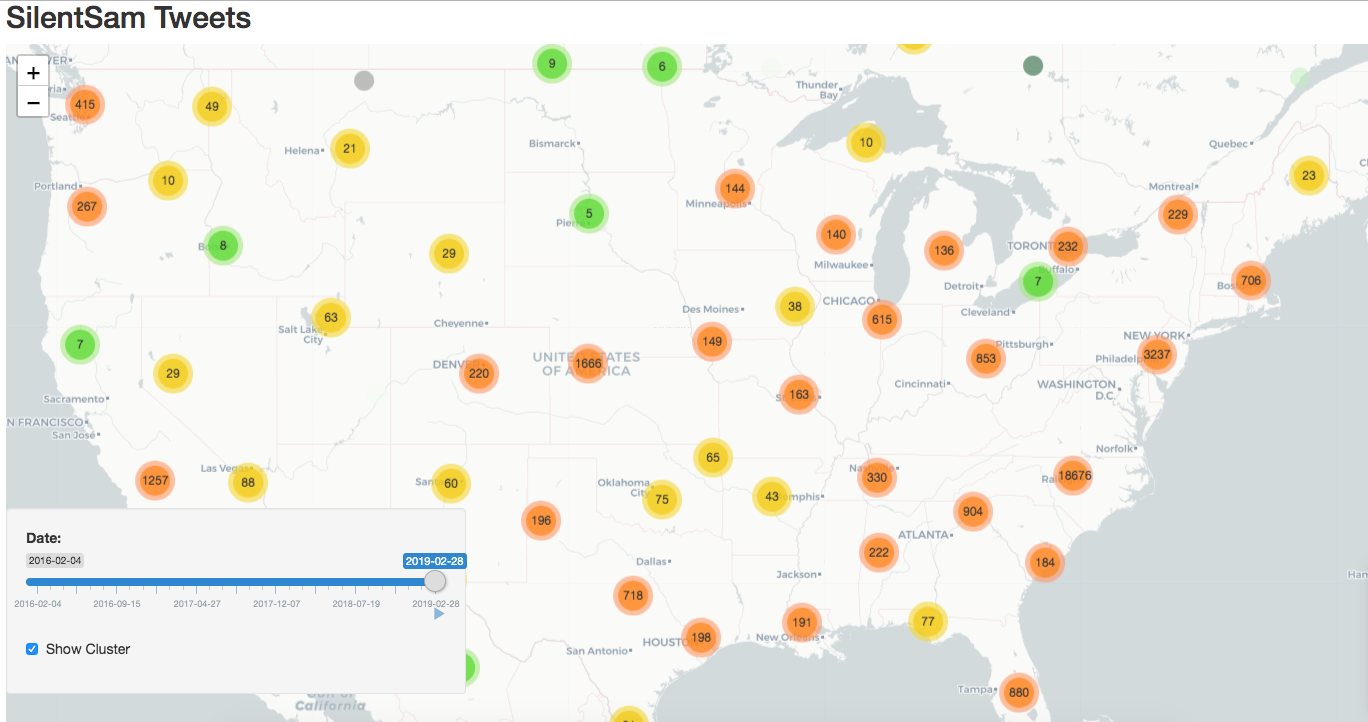
This map shows the distribution of tweets across the world (as of August 23, 2018). 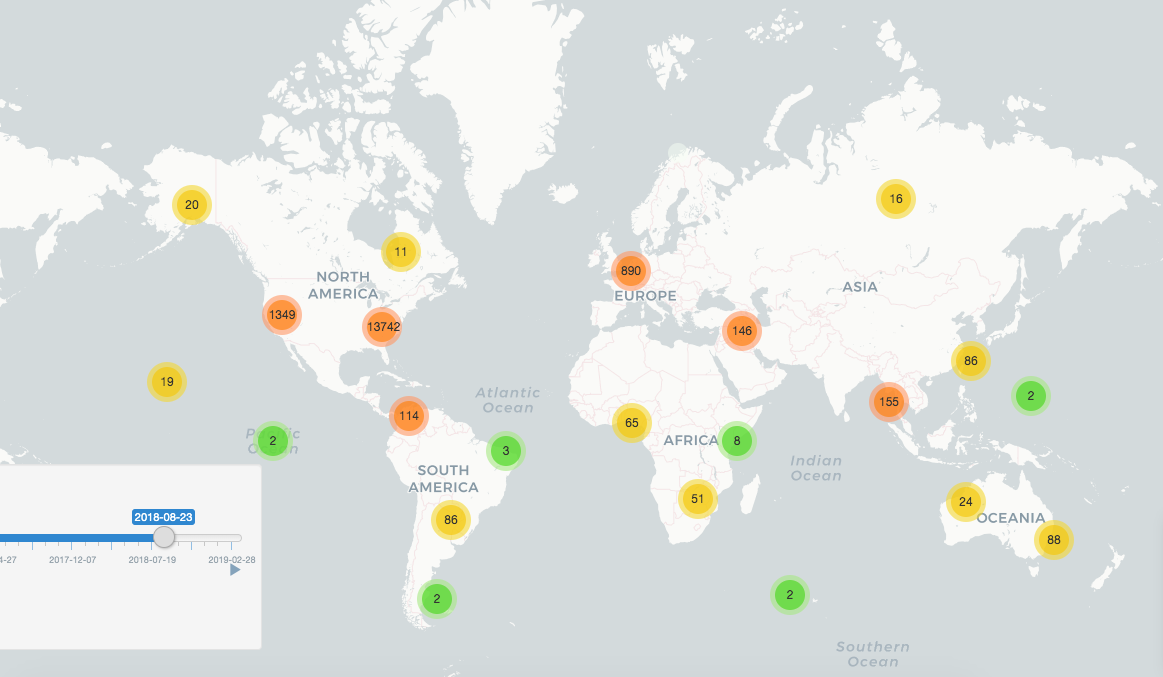
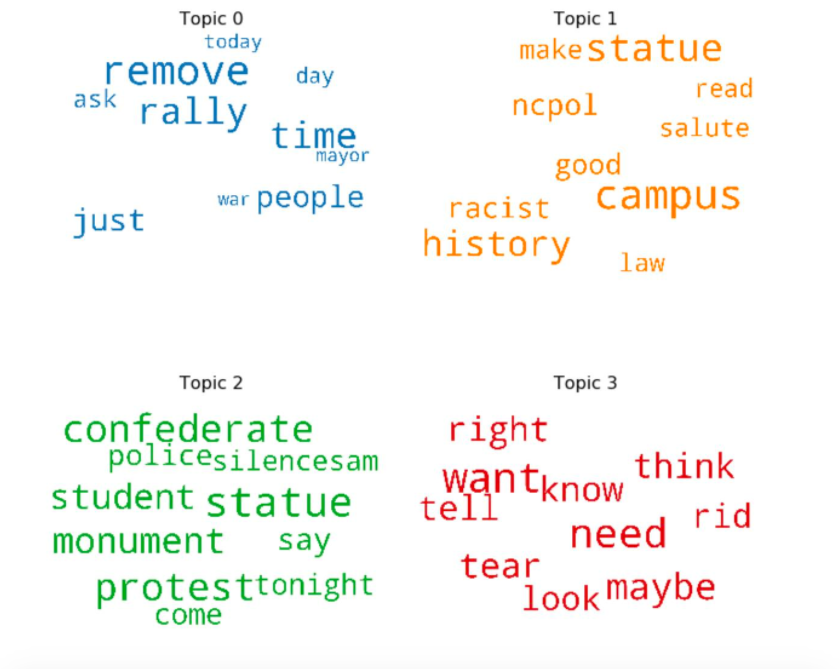
This visualization shows the result of topic modeling the text of the original tweets.